 View details
Multiplication Chart Printable and Times Tables Chart (1-12)
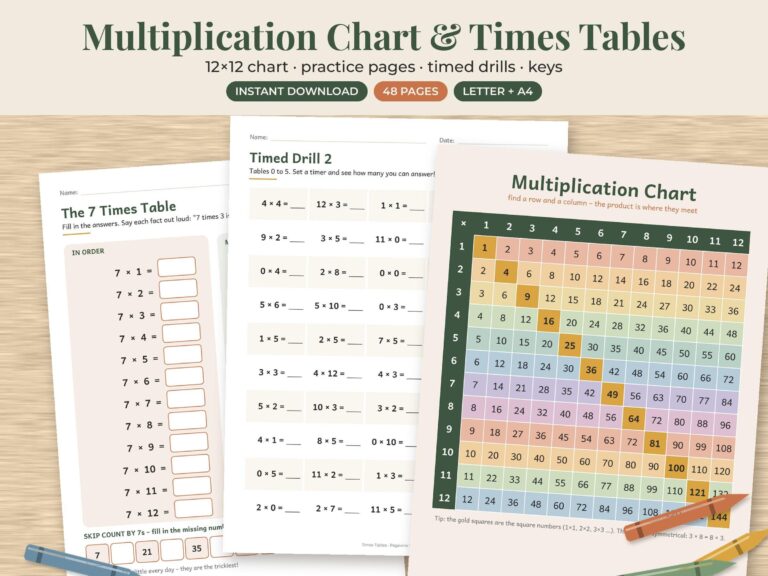
A multiplication chart is the single most useful reference sheet a child can have while learning to multiply. In the US it is usually called a multiplication chart or multiplication table. In the UK, children learn their “times tables”, so parents search for a times tables chart. It is the same grid either way: numbers across the top, numbers down the side, and every product where a row meets a column.
This page explains how to choose the right chart, the order most children find easiest for learning the facts, and how to print a chart that lasts the whole school year.
What the standards expect
Both the US and England set a clear target for multiplication facts:
- United States: under the Common Core grade 3 standards, students should know from memory all products of two one-digit numbers by the end of third grade.
- England: Year 4 pupils take the multiplication tables check in June, a set of 25 timed questions on tables up to 12.
That is why the most common chart covers 1 to 12. It matches the UK check and goes a little beyond the US target.
1–10, 1–12 or 1–20: which chart?
| Chart | Best for | Notes |
|---|---|---|
| 1–10 | Second graders and children just starting out | Smaller grid, bigger numbers, less overwhelming |
| 1–12 | Grades 3–4, Year 3–4, and most homework | The standard choice. Covers everything in the UK check |
| 1–20 | Older students and confident learners | Useful for spotting patterns, but too dense for first learning |
| Blank chart | Practice and quick checks | Children fill it in themselves. Great for weekly review |
How to read a multiplication chart
To find 7 × 8, put one finger on 7 in the left column and another on 8 in the top row. Slide them toward each other until they meet: the square says 56. Show your child that 8 × 7 lands on 56 too. That one observation halves the work ahead.
Fewer facts than it looks
A 1–12 chart has 144 squares, which can feel like a mountain. But because 3 × 8 and 8 × 3 have the same answer, there are only 78 different facts. And many of those are already easy:
- × 1 is the number itself.
- × 10 adds a zero.
- × 2 is doubling.
- × 5 always ends in 5 or 0, and is half of × 10.
- × 11 up to 9 repeats the digit: 11, 22, 33.
- × 9 has a pattern up to 9 × 10: the digits of each answer add up to 9 (18, 27, 36), and the tens digit is one less than the number you multiplied by.
- Square numbers (1, 4, 9, 16…) run diagonally from corner to corner. Point this out early, because it helps children find their place on the grid.
A learning order that works
A common teaching sequence builds each new table on one the child already knows:
- 2s, 5s and 10s
- 3s and 4s (4s are double the 2s)
- 11s, then 9s, using their patterns
- 6s and 8s (double the 3s and the 4s)
- 7s and 12s
The 7s usually feel hardest, but by this stage almost every 7 fact has already turned up in another table. Only 7 × 7 and 7 × 12 are new.
Five-minute practice routine
Short, frequent practice beats long sessions. A routine many families use:
- Day 1: read one table aloud from the chart, then cover the answers and say them again.
- Days 2–3: a worksheet on that table, using the chart only to check.
- Day 4: mixed questions from that table and earlier ones.
- Day 5: fill in a blank chart from memory and circle the facts that slowed you down. Those are next week’s focus.
The Multiplication Chart and Times Tables Worksheets set pairs a 1–12 chart with worksheets for this kind of practice. It is aimed at third and fourth graders, homeschoolers and tutors.
Printing a chart that lasts
- Use cardstock. A chart lives in a homework folder for months, and plain paper creases fast.
- Print at actual size when the paper matches the file. If you print a US Letter file on A4 paper, or the other way round, choose “Fit to page” so the grid edges are not cut off.
- Laminate it or slide it into a sheet protector. Children can then circle facts with a dry-erase marker and wipe it clean.
- Print two copies: one for the desk and a smaller one (2 pages per sheet) for the pencil pouch.
- Keep a stack of blank charts for weekly self-tests.
For younger learners and homeschool families
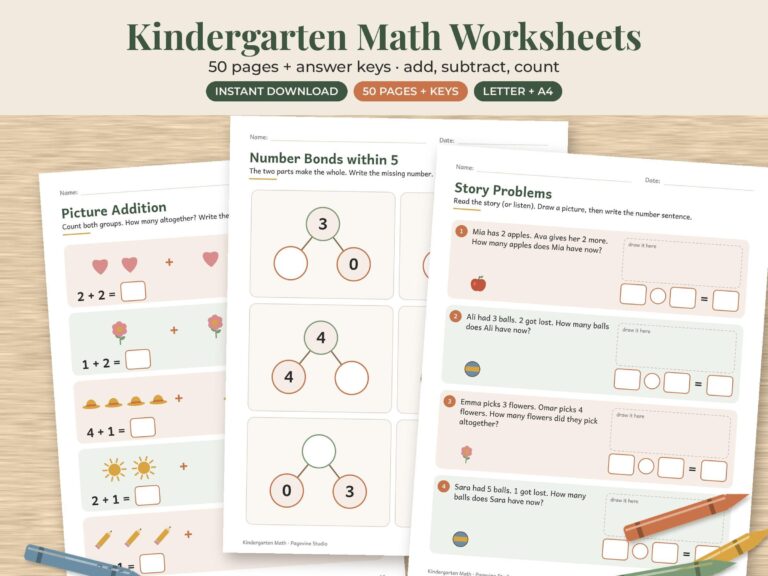
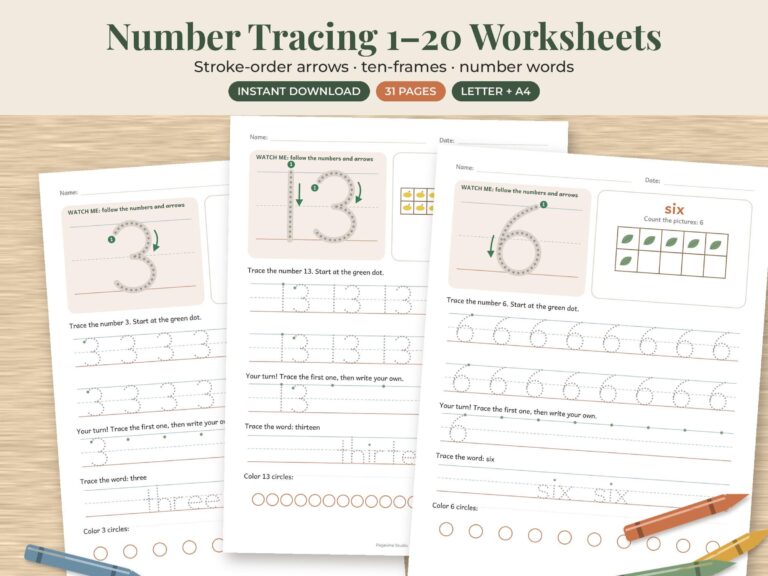
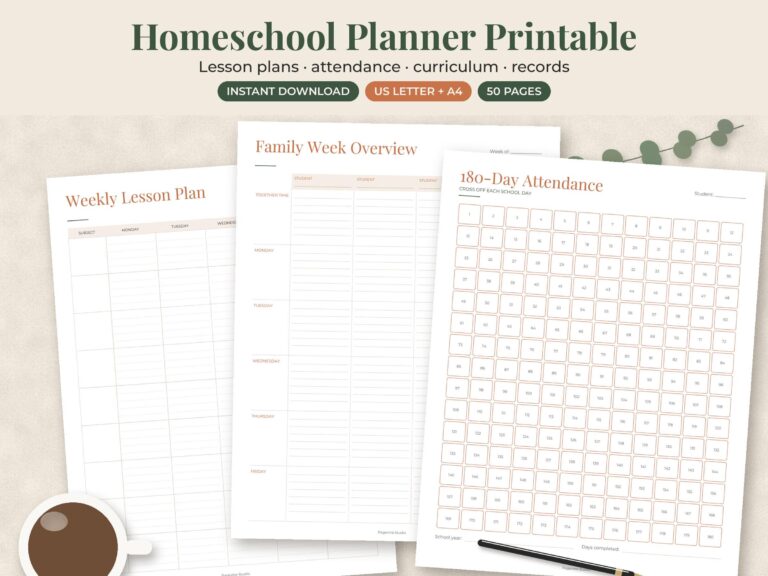
Not ready for multiplication yet? Start with counting and number tracing, then addition and subtraction. If you are organizing a full year at home, a planner helps you keep track of which tables are done.

Looking for more for the kids? Try our chore chart printables or coloring pages, or browse all kids’ worksheets and classroom printables.
Get the chart and start this week
Print the chart, stick it where homework happens, and practice one table at a time. Our math printables are instant downloads from our Etsy shop, ready to print at home.